At CIUS, we’ve recently been working on automatic interpretation of well logs through machine learning. In July, the Journal of Petroleum Science and Engineering published this work as an article, which I wrote together with Ioan Alexandru Merciu (Equinor), Lasse Løvstakken (NTNU/CIUS) and Svein-Erik Måsøy (NTNU/CIUS). Our article is open access, so you can always go read the full thing wherever you are. But if you feel like reading a shorter summary instead of a 17-page article, this blog post is for you.
Well log interpretation
Well logs are essentially measurements from petroleum wells. Many types of well logs can be made, for many different purposes. We are most interested in well integrity logs (which I wrote about here) using acoustic tools (which I wrote about here). However, logging is not straightforward, and it is not always obvious what the log data says. That’s why trained professionals must interpret well logs to evaluate what’s actually down there.
But interpretation is not an easy task either. The log data is complex, and can be inaccurate and/or ambiguous. Therefore, the interpreters need use their knowledge of the physics underlying each type of measurement to translate the data into a good understanding of the well status. A difficult job indeed, made moreso by the time pressure interpreters typically face. Thus, it’s no wonder that different interpreters can sometimes come to different conclusions from the same data.
The idea of automatic interpretation is to make interpreters’ jobs easier. If they can start with a fairly accurate automatic interpretation, the easier parts of their job are already done. This lets them focus their time and effort on the most complex regions of the log.
How to build an automatic interpretation system?
As we explain in the article, interpreting well logs is hard enough for trained professionals. Writing a program that duplicates their decision-making process would be even harder. Imagine translating this process into code for every possible case that might come up; it’s a Herculean, if not Sisyphean, task.
Fortunately, machine learning saves us from having to do that. Instead, we can show interpreted data to a supervised learning algorithm. It will then learn by itself how it should interpret different types of log data. With a good setup and enough data, the trained algorithm will be able to make reasonable interpretations of data it has not yet seen, at least if it resembles data that it has seen before.
Our dataset
For this work, Equinor provided a dataset with around 60 km of interpreted well log data. Equinor’s interpreters had already split the logs into intervals and annotated each interval according to two parameters:
- Bond quality: How good is the bond between the casing and any solids outside it in this interval? This parameter has six possible values, ‘Good’, ‘Moderate to good’, ‘Moderate’, ‘Poor to moderate’, ‘Poor’, and ‘Free pipe’.
- Hydraulic isolation: Is this interval likely to be hydraulically isolated, so that no fluids can flow outside the casing? This parameter has two possible values, ‘Yes’ and ‘No or uncertain’.
A small part of this data is in Equinor’s open Volve Data Village dataset. Thus, you can even have a look at it yourself. The Volve wells F-9 and F-11 B have integrity logs that were interpreted in this way.
Most of the well logs use both a sonic and an ultrasonic tool. The main sonic tool Schlumberger’s Digitizing Sonic Log Tool (DSLT), and the main ultrasonic tool is Schlumberger’s Ultrasonic Imager Tool (USIT). From each log data file, we drew a selection of data channels that are either directly or indirectly important for well log interpreters in their task.
Machine learning setup
Defining the task
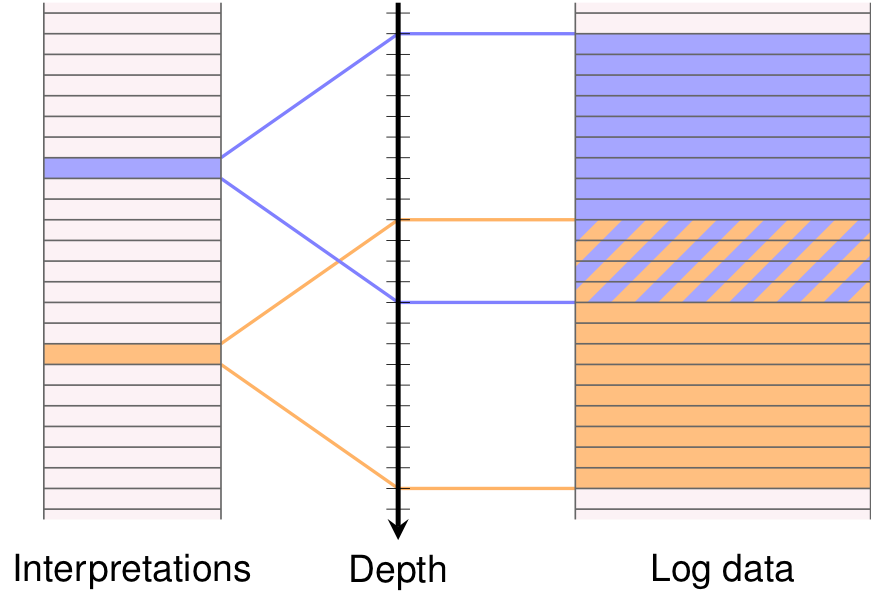
The first step of machine learning is to specify what the task of the machine learning system is. For our automatic interpretation system, we wanted it to classify the bond quality and the hydraulic isolation of every 1 m segment of the well. As a basis for its decision, we give it the aforementioned log data channels in a 13 m interval surrounding the 1 m segment. The figure shows this for two example segments. (With this task, segments that are close necessarily have to be interpreted from partly overlapping intervals, like the figure shows.)
So, our machine learning system will train itself to reproduce human well log interpretations from the surrounding well log data. But defining the task is not enough. We also need to choose a trainable algorithm to use for the machine learning.
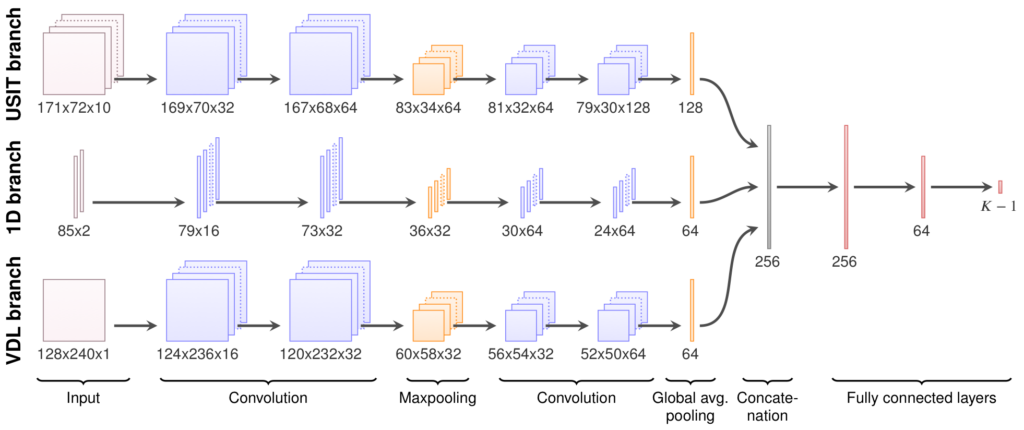
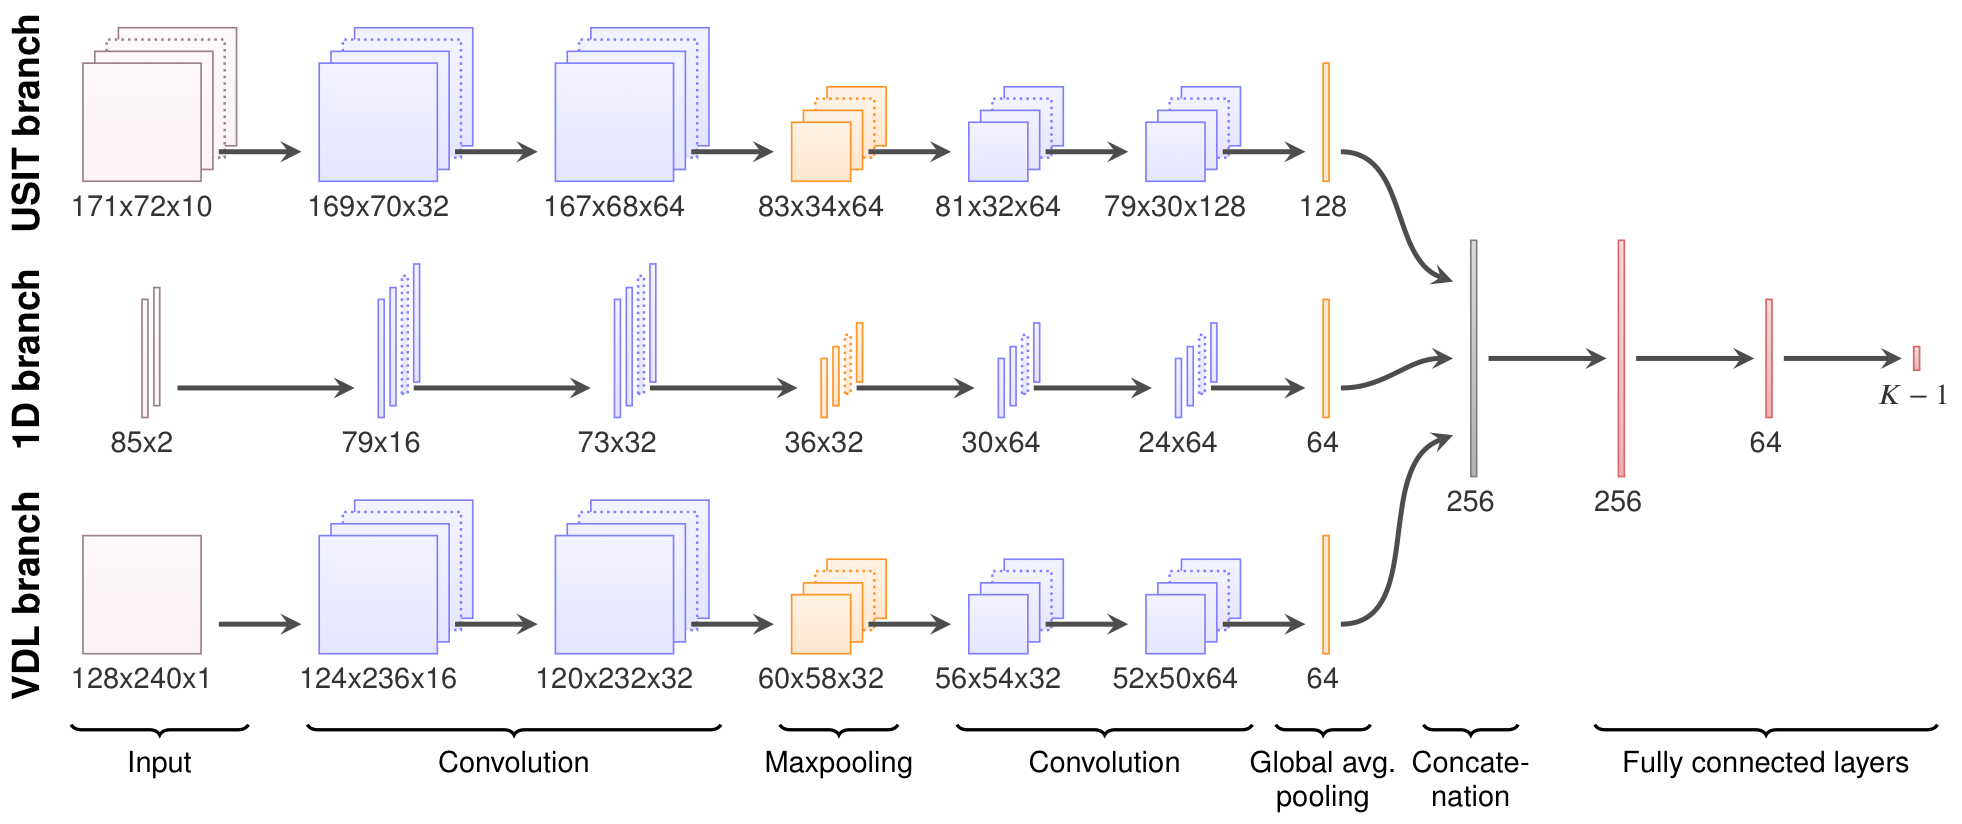
Convolutional neural networks
Well log data is essentially a collection of 1D curves and 2D images. Thus, the task of classifying the data in each 13 m interval is essentially an image classification task. Research over the last 10 years have shown that deep convolutional neural networks are very effective at such tasks. We therefore use this kind of algorithm, basing the specifics on best-practice suggestions from François Chollet’s book on deep learning.
Results of the automatic interpretation
So, how good is our automatic interpretation system at making correct predictions? Actually, we have no way to tell. For one thing, we have no ground truth, no certain answers for what’s actually down there in the well. Additionally, the annotation system is somewhat subjective by nature. What one interpreter might call ‘Moderate to good’ bond quality, another might call ‘Good’.
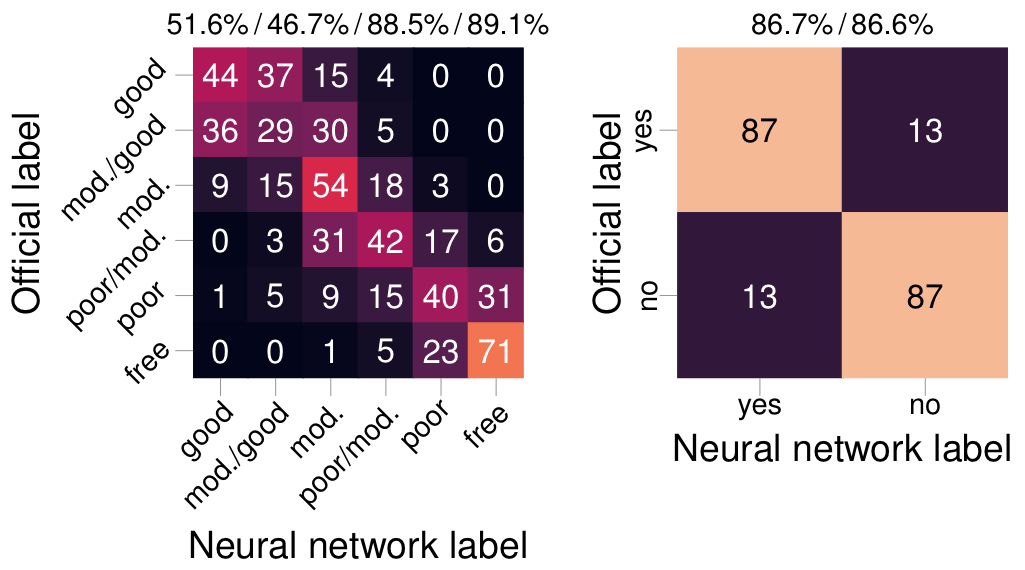
But what we can tell is how well it does what we trained it for, namely making the same interpretations as experts. The confusion matrices to the right compare the expert interpretations with the interpretations of the automatic system. For the bond quality, it chooses the same or neighbouring label as the human interpreter 89% of the time. For the hydraulic isolation, it chooses the same label 87% of the time.
Comparing against human performance
Getting a 100% match with a human interpreter is a pipe dream, for a simple reason: Human interpreters are themselves not 100% consistent. This inconsistency means two things. First, the training process might give mixed messages to the automatic interpretation system. Thus, it might see one data example labelled as ‘Good’ bond quality and another very similar example labelled as ‘Moderate to good’. This would confuse the system while training. Second, the interpretation system might use inconsistent data for testing. Consider an example where it sees during training that a certain type of data represents ‘Good’ bond quality. If the test set labels similar data as ‘Moderate’, that would count as the system making a mistake.
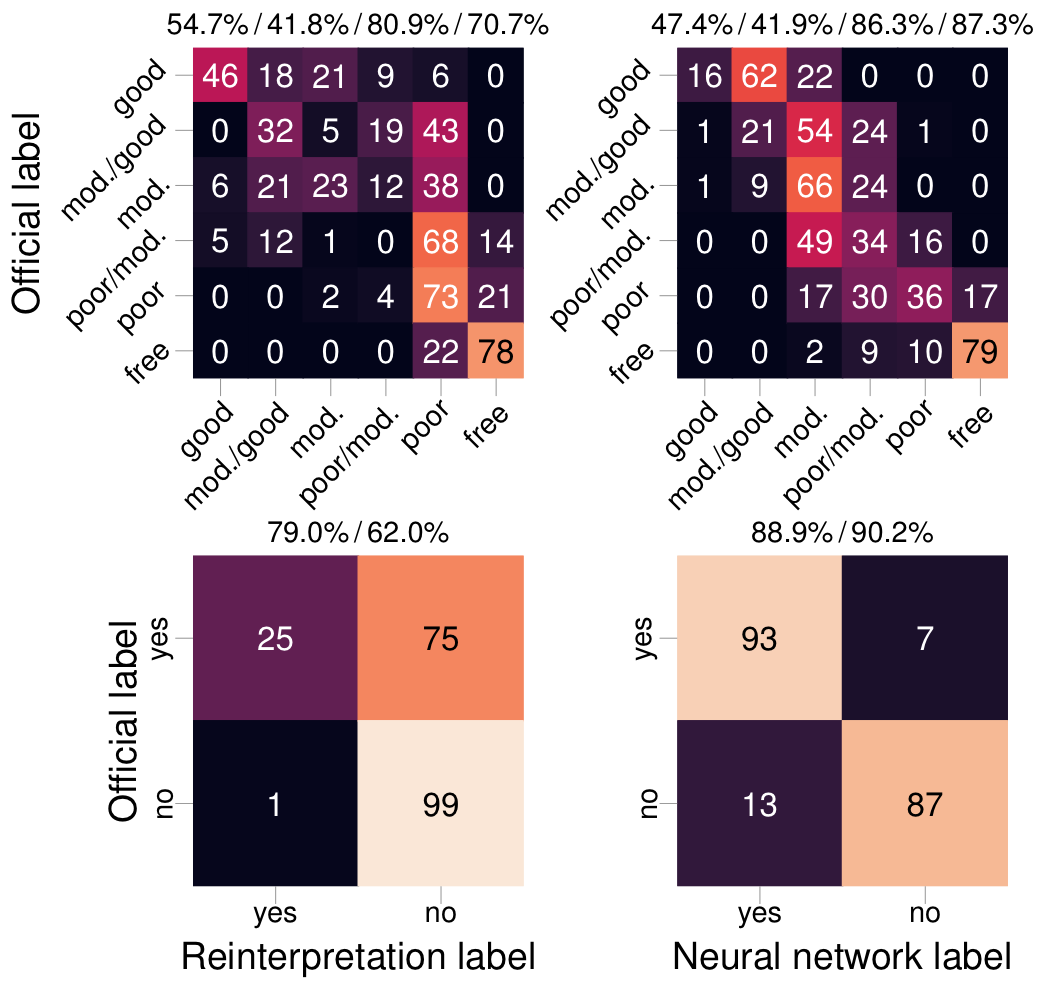
Thus, there is an upper performance limit, related to how consistent expert interpreters are. To investigate, we asked a skilled interpreter to reinterpret 1/6 of our dataset. We then checked how well his interpretations and the automatic interpretations matched the original interpretations for this subset of the data.
As it turned out, the reinterpreter’s interpretations were generally more conservative than the original interpretations in the dataset. On the other hand, the automatic interpretation system had trained on interpretations from the original team of interpreters. (It did not train on the interpretations it used for testing, of course; that would be cheating!) Hence, it might to a greater degree share the same biases as the original interpretation team.
All in all, the automatic interpretation matches the original interpretations better, according to five out of our six metrics. Of course, we cannot conclude that our automatic interpretation system has superhuman performance. However, it does indicate that the system has, at the very least, comparable quantitative performance with skilled interpreters.
Overview: Automatic interpretation as a machine learning problem
As machine learning problems go, this is not a simple one. On the input side, the data is quite heterogeneous. Some of the data channels we use as input are present in some well logs, but not in others. Different logs were recorded with different physical resolution. And many data channels contain systematic errors, such as spikes at casing collars every 12 or so metres. Human interpreters understand and work around these errors, which could fool a naïve machine learning setup.
On the output side, the subjectivity of interpretations is challenging. Different experts can come up with different well log interpretations. With such inconsistencies present in the dataset used for training and testing, the performance of machine learning systems is limited. In most problems, machine learning performance can be improved by using a bigger dataset. Here, however, we found that using even as little as 38% of our dataset hardly changed performance. This indicates that the subjectivity limits performance more than any lack of data.
However, there are still some measures that can be taken. One is to make sure that the dataset is thoroughly quality controlled, hand-picked as an internally consistent reference. Another is to use a more objective annotation system than the rating scale used here, which is inherently somewhat subjective.
More in the article!
This blog post only covers the basics of the article. The full version covers a lot more, including things I did not even mention here. For example, it gives an overview of the basics of log interpretation, with an example of to interpret integrity logs. It covers another very simple machine learning model that we used as a baseline to see how good performance we could get with a trivial approach. And it discusses other factors, beyond subjectivity, that may limit performance. Go on, have a look!
All images in this post were taken from the article under a CC BY 4.0 licence.
Do you have a Github link for your code? It will be helpful if there is one.
I really wish that I could share my data and my code, but the vast majority of the data is proprietary and cannot be released. I would have to apply to release the code as well, and it’s so closely connected with the data that it wouldn’t be particularly useful or helpful by itself.
Can you please replace data with any random data and share the code? It would be very helpful. Thank you.
There’s still the problem that I don’t have the rights to share the code with people — I would have to write a formal application to my research centre. And thoroughly checking the code and anonymising it to make sure that it doesn’t reveal anything internal or proprietary would take time. I am unfortunately too busy these days to take on something like that.
I would rather recommend that you check out my new post on the same topic, and the journal articles that it summarises. Not only does the approach I followed in that work perform better, is is also simpler to implement. Furthermore, the code I wrote in the collaboration project with Equinor (described in that post) is in the process of being open sourced, Equinor just needs to get over some administrative hurdles.
Thank you for your prompt response. Nice work.
Pingback: New adventures in assisted well log interpretation - Erlend M. Viggen