
In this series so far, we have looked at how we use decibels to put numbers on the loudness of sounds (Part 1), how we can compensate for humans hearing some sound frequencies better than others (Part 2), and how we can determine decibel numbers for sounds that vary significantly in time (Part 3). We can consider what we have looked at so far as being building blocks. With these blocks, we can construct the acoustic quantities used in noise regulations throughout the world.
In this fourth and final part, we will look more closely at these more advanced quantities. In Norway, for example, noise regulations use such quantities to define concepts such as red and yellow noise zones. (I will use Norwegian noise regulations as an example throughout this post; these are the ones that I have particular experience with. However, noise regulations in many other countries will be similar.)
A real-world noise regulation
To find some examples of quantities that are in use, let’s look up Norway’s perhaps most important noise regulation: T-1442/2016: Retningslinje for behandling av støy i arealplanlegging. Its title translates to “Guideline for treatment of noise in area planning”, and it is published by the Norwegian Ministry of Climate and Environment.
Red and yellow zones
Let me translate its definition of the two noise zones this noise regulation uses:
- red zone, closest to the noise source, specifies an area that is not suitable for noise-sensitive usages, and establishing new buildings with noise-sensitive usages shall be avoided
- yellow zone is an assessment zone, where buildings with noise-sensitive usages can be constructed if mitigating measures provide satisfactory noise conditions
In short, you cannot build e.g. houses or offices in the red zone. In the yellow zone, you can do so if you take special measures. These could for example be adding extra noise insulation or noise screening.
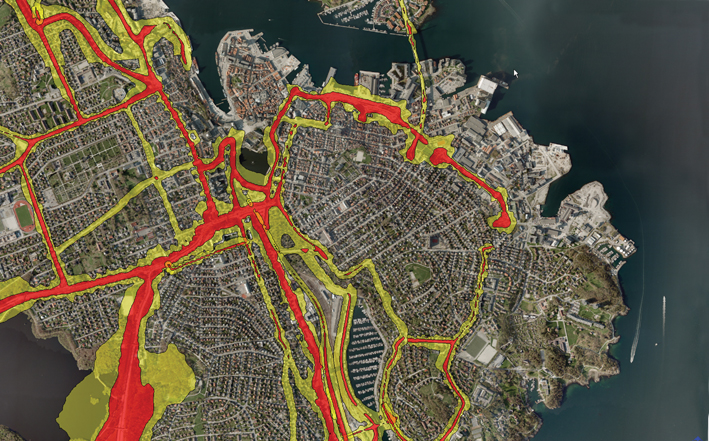
For each type of noise source, the regulation specifies one or more acoustic quantities as thresholds for the two zones. If the noise in an area exceeds one of the red zone thresholds, that area is part of the red zone. If it does not, but it exceeds one of the yellow zone thresholds, the area is part of the yellow zone. Otherwise, the regulations do not put any restrictions on what kind of buildings can be constructed in the area.
Acoustic quantities
Let us look at the acoustic quantities that the regulation uses:
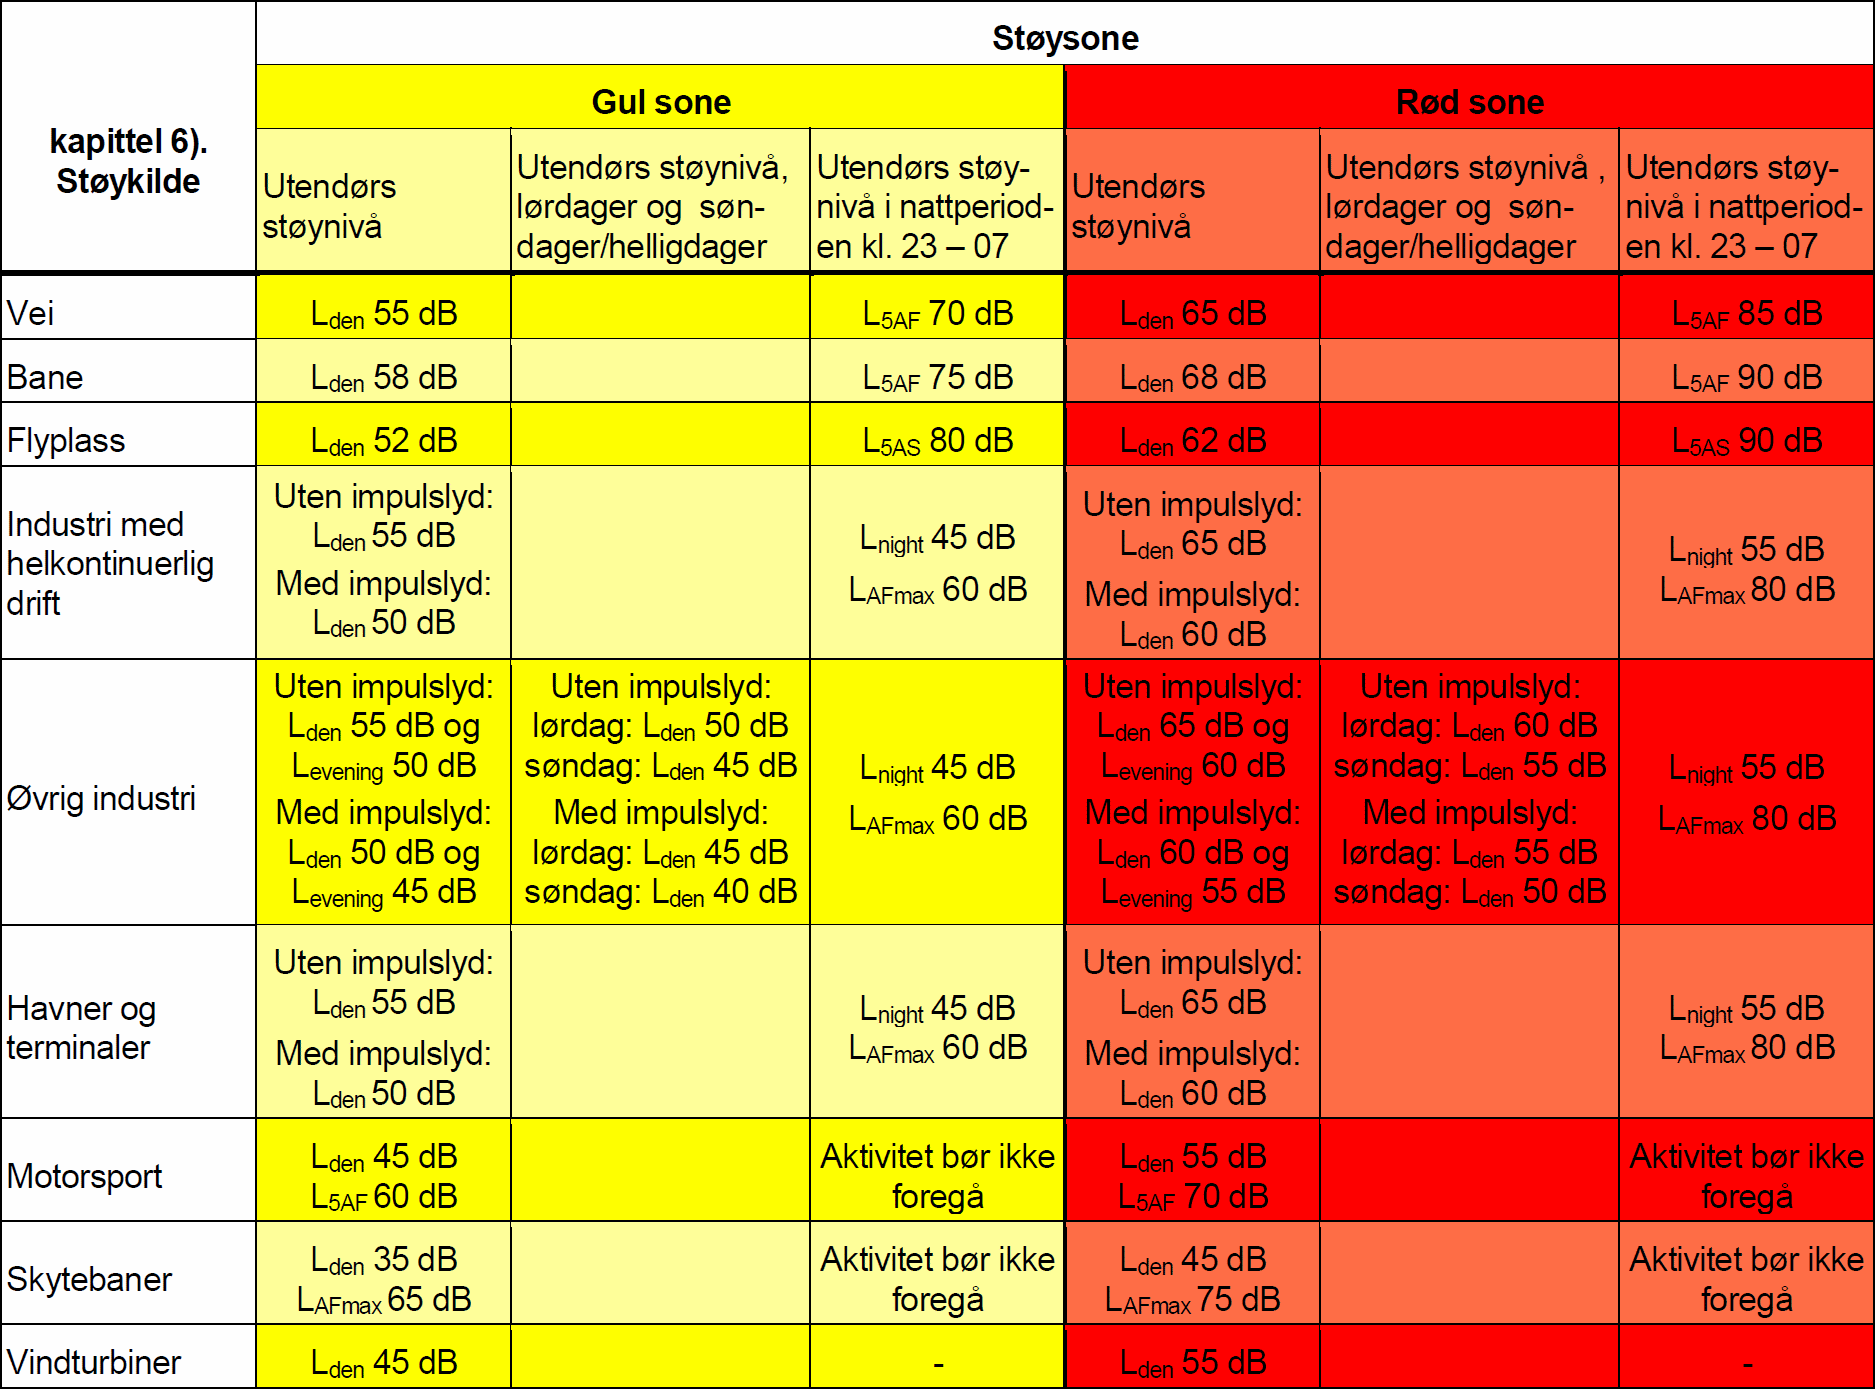
Please don’t mind that it’s in Norwegian; what matters is which international acoustic quantities it uses. We already know one of them from earlier in this series, namely \(L_\text{AFmax}\). We can find this one by:
- A-weighting in frequency
- Fast-weighting in time
- Finding the maximum value over time, i.e. the largest value of \(L_\text{AF}(t)\)
We have, however, not seen the rest of the quantities. Let us look more closely at them now.
Day, evening, and night

It is often useful to distinguish between noise at different hours. Say that the factory next to your home is loud during the day while you are out working. Not that important, right? However, it’s worse if it’s loud in the evening when you want to enjoy reading in your garden. And it’s even worse if it’s loud during the night when you are trying to sleep with your window open.
For that reason, three time-of-day quantities have been defined. These cover noise during the daytime, during the evening, and during the night. These are all A-weighted equivalent levels. From Part 3, we know that equivalent levels collect all the sound in a given period of time, and represents it as one level. That level corresponds to the sound pressure level of a steady sound that would give you the same noise dose over the period as the sound that you were actually exposed to.
Calculation
We generally calculate A-weighted equivalent levels as:
\( p_{\text{eq},T} = \sqrt{ \frac{1}{T} \int_{T_1}^{T_2} p_\text{A}^2(t) \, \mathrm{d}t } , \qquad L_{\text{eq},T} = 20 \log \left( \frac{p_{\text{eq},T}}{p_\text{ref}} \right) \) ,
where \(p_\text{A}(t)\) is A-weighted sound pressure as function of time and \(T\) is a time period from the time \(T_1\) to the time \(T_2\).
The three equivalent levels for daytime, evening, and nighttime are:
- \(L_\text{day}\): A-weighted equivalent level in the period 07–19 (12 hours),
- \(L_\text{evening}\): A-weighted equivalent level in the period 19–23 (4 hours), and
- \(L_\text{night}\): A-weighted equivalent level in the period 23–07 (8 hours).
If you live next to a noise source generating the same amount of noise throughout the day, these three levels will be equal. If, however, the noise source varies throughout the day, this variation make the day, evening, and night levels different. For example, road traffic typically has a much lower \(L_\text{night}\) level; people don’t drive so much at night.
\(L_\text{den}\): Overall day-evening-night level
In principle, we could make noise regulations by defining limits in \(L_\text{day}\), \(L_\text{evening}\), and \(L_\text{night}\) individually. However, it’s more convenient to use one single acoustic quantity as a threshold. Such a quantity must take into account the total noise over the entire day-night period. It must also take into account that noise during the evening and the night is more annoying.
For this reason, the EU has defined a quantity called day-evening-night level. We can calculate this by combining the different levels for day, evening, and night, with penalties. Evening noise gets a penalty of 5 dB, while night-time noise gets a penalty of 10 dB. Thus, we get a single acoustic quantity that can almost always predict the average noise annoyance of a large group of people fairly well.
We typically denote the day-evening-night level as \(L_\text{den}\), and calculate it as
\( L_\text{den} = 10 \log \left( \frac{12}{24} 10^{L_\text{day}/10} + \frac{4}{24} 10^{(L_\text{evening}+5)/10} + \frac{8}{24} 10^{(L_\text{night}+10)/10} \right) \).
While this formula might look a little complex, it basically just averages \(L_\text{day}\), \(L_\text{evening}\), and \(L_\text{night}\) over 24 hours. It takes into account that the daytime period is 12 hours, the evening period is 4 hours, and the night period is 8 hours. It also adds a 5 dB penalty to the evening noise and a 10 dB penalty to the night-time noise.
Comparing \(L_\text{den}\) and \(L_\text{Aeq,24h}\)

To further clarify \(L_\text{den}\), we can compare it with \(L_\text{Aeq,24h}\), the A-weighted 24-hour equivalent level that we looked at in Part 3. The difference between the two is really just the penalties applied in \(L_\text{den}\). If we have a noise situation where all the noise occurs during the day, the noise triggers no penalties. In that case, the two quantities are equal. If all the noise occurs during the evening, the evening penalty makes \(L_\text{den}\) 5 dB higher than \(L_\text{Aeq,24h}\). And if all the noise occurs during the night, \(L_\text{den}\) becomes 10 dB higher due to the night-time penalty. Finally, if the noise is the same throughout the day, evening, and night, we can calculate that the total penalties make \(L_\text{den}\) 6.4 dB higher than \(L_\text{Aeq,24h}\).
Statistical levels
In the table above, we can also see two statistical quantities, \(L_\text{5AF}\) and \(L_\text{5AS}\). The Norwegian regulation T-1442 uses these to limit noise from roads, railways, airports, and motor sports. The two quantities are based on events, which in this case means pass-bys of individual road vehicles, trains, or aircraft.
Let us look at this with an example. When a single aircraft passes by, the sound level will increase as the aircraft approaches, peak when the aircraft is at its closest, and then decrease as the aircraft moves away. This pass-by represents one single event. If we measure the sound level with A-weighting in frequency and Slow weighting in time, i.e. \(L_\text{AS}(t)\), we can find the maximum level \(L_\text{ASmax}\) for the event. Let us then expand our perspective from a single pass-by to all pass-bys over a longer period, such as a year. In principle, we could measure \(L_\text{ASmax}\) for all of them. (In practice, these values are calculated through simulations instead; actually measuring all pass-bys over a year would be a hopeless task.) From these values of \(L_\text{ASmax}\), we can find \(L_\text{5AS}\), which is defined as the level exceeded only by the 5% most noisy events.
Even though the Norwegian regulations define \(L_\text{5AF}\) and \(L_\text{5AS}\) from the 5% noisiest events, there are also similar acoustic quantities defined from the level exceeded 5% of the time. And of course, you can also define quantities from other percentages than 5%.
How statistical levels can break down
Using \(L_\text{5AF}\) and \(L_\text{5AS}\) in noise regulations thus limits the share of events that can exceed a certain noise level. It does not, however, limit the level of the strongest events. Let’s look at an illustrative (though deeply unrealistic) example of how this can go horribly wrong. Imagine that 4% of the aircraft events at your home are low-flying fighter jets, while the remaining 96% are high-altitude aircraft that you hardly hear. Even though this is an intense noise situation, it would not exceed a typical \(L_\text{5AS}\) limit. Therefore, we can see in the table from T-1442 that \(L_\text{5AF}\) and \(L_\text{5AS}\) appear together with \(L_\text{den}\), which would definitely be exceeded in this example.
These limits also have other strange side effects. Let’s say that the previous example had 6% extremely noisy events and 94% almost quiet events. In that case, we could paradoxically comply with an \(L_\text{5AS}\) limit by increasing the amount of nearly quiet events so that the distribution becomes e.g. 4.9% vs. 95.1%. This shows how difficult it is to make good acoustic quantities and set good noise limits!
Summary
This series has brought us through a fundamental description of sound levels, how we can calculate them according to how we humans hear, and how we can take into account that most noise varies in time. In this final part, we saw how we can put all of this together. This gives us the acoustic quantities that real-world noise regulations use.
If you have read this series from the beginning, I hope you have been able to follow it, and have gained a better understanding on how we can use numbers to describe sound loudness. If you should come across other acoustic quantities not described in this series, I hope that it will have prepared you to understand them. But of course, please leave a comment if you would like to have something explained!
This post is a translation of a Norwegian-language blog post that I originally wrote for acousticsresearchcentre.no. I would like to thank Rolf Tore Randeberg for proofreading and fact-checking the Norwegian original.
Pingback: Acoustic quantities, part 1: What are decibels? | Erlend M. Viggen