
In the previous part of this series, we looked at what decibels are. To put it simply, we can measure a sound, find a representative sound pressure for it, put this into a logarithmic formula, and voilà – we have a sound pressure level in decibels. However, humans cannot hear every sound equally well. The basic calculation of sound pressure level does not take this into account. This means that there are sounds we can hear hardly or not at all, that have the same physical sound pressure level as sounds that we hear well. Therefore, a number of techniques, such as A-weighting and C-weighting, have been developed to let us calculate sound pressure levels that fit our hearing better.
In this part, we will discuss how sound consists of different frequencies, how we do not hear these frequencies equally well, and how we can take this into account when calculating sound pressure levels.
Sound and frequency
From part 1, we know that sound is fluctuations in the air pressure. For so-called pure tones, these fluctuations are completely periodic. The sound pressure goes up, down, up, down, and so forth, and every fluctuation takes exactly the same time. The time that a sound wave needs to complete an entire cycle, i.e. go from a sound pressure peak to the next sound pressure peak (and from a sound pressure trough to the next sound pressure trough) is the period of the sound wave, and we can measure it in seconds. For audible sounds, a sound wave’s period can range from some tens of microseconds to some tens of milliseconds.
Another way to represent a pure tone, is by how many cycles it completes per second. This is the frequency of the tone, and we measure it in Hertz (which we usually abbreviate as Hz). Frequency and period are closely connected quantities. In fact, they are each others’ reciprocals, meaning that you can find the period by dividing 1 by the frequency, and you can find the frequency by dividing 1 by the period. Frequency is tied to how we perceive the sound. We typically say that a tone with a low frequency is ‘deep’ or ‘dark’, and that a tone with a high frequency is “high” or “bright”.
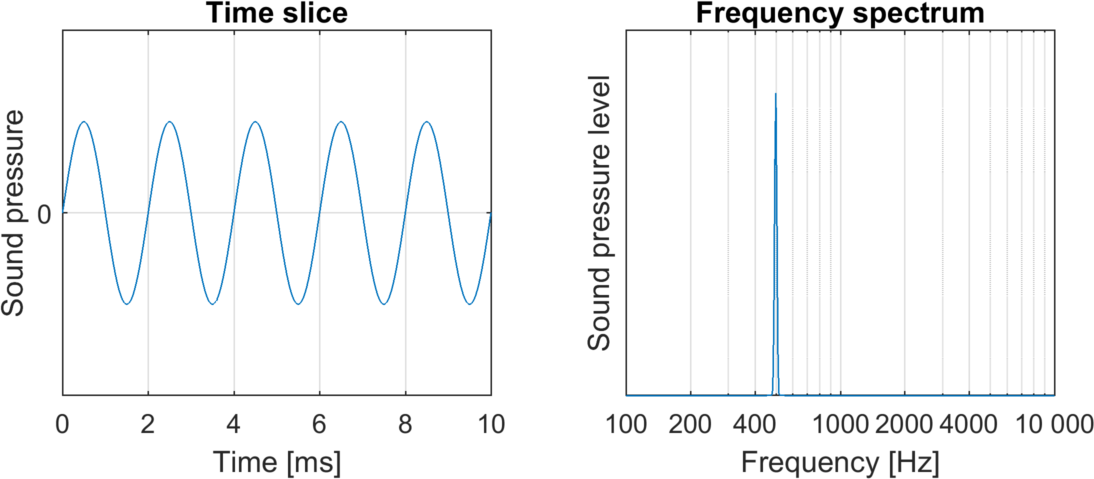
Here are some examples of tones with different frequencies:
500 Hz
2000 Hz
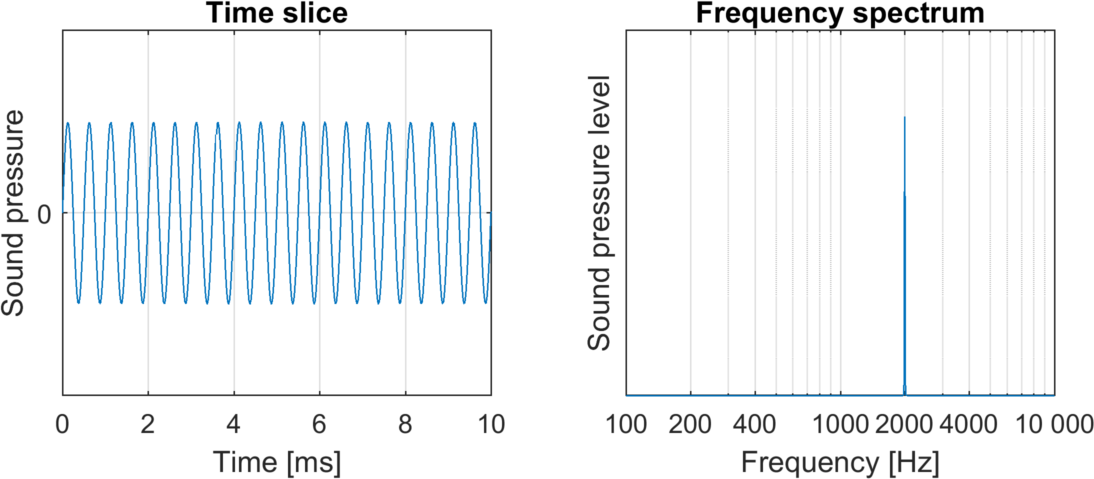
Here we can see that the tone at 500 Hz changes more slowly in time than the tone at 2000 Hz. (In other words, the former has a longer period than the latter.) The rightmost graphs show frequency spectra, i.e. which frequencies the two sounds consist of. However, since both sounds are pure tones, each only consists of a single frequency. (I put no numbers on the y-axes here, as I don’t know the sound pressures and sound pressure levels at which you are listening to these sounds. I can’t control your speakers’ volume knob from here!)
However, it is rare that we hear sounds that only consist of a single frequency. Most sounds that we hear are not pure tones; they are not even periodic! Still, we can view them as a distribution of various frequencies. We will perceive sounds with mostly low frequencies as ‘dark’ or ‘bass-heavy’, and sounds with mostly high frequencies as ‘bright’ or ‘treble-heavy’.
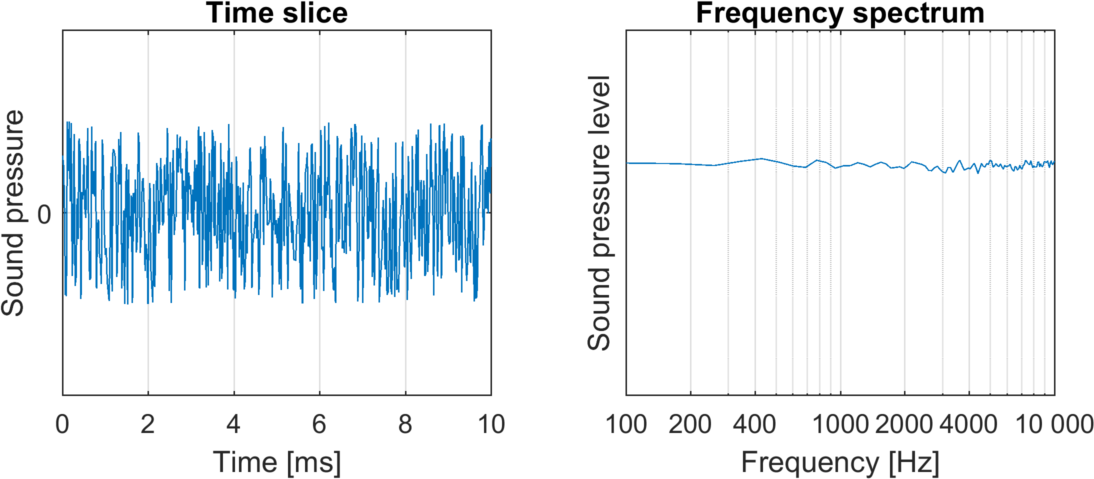
Here are some examples of white noise and pink noise, two sounds with different frequency distributions:
White noise
Pink noise
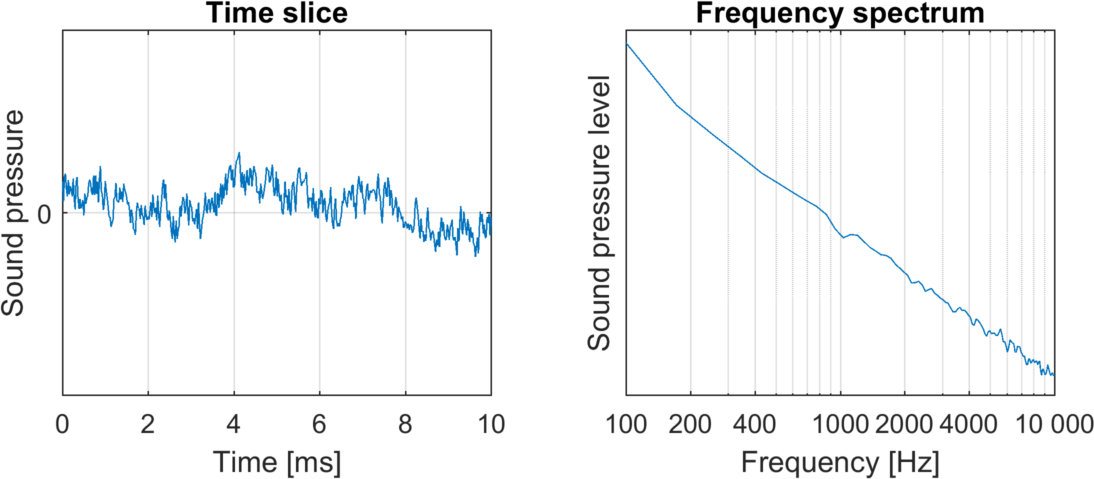
The hallmark of white noise is that it always has an equal distribution of every frequency. Pink noise, on the other hand, has more low than high frequencies. Thus, we perceive pink noise as ‘darker’ than white noise.
How well do we hear different sounds?
We often say that young people with ‘normal hearing’ can hear frequencies from around 20 Hz to around 20 000 Hz. This is not really wrong, but the truth is more nuanced.
First of all, there are large variations between people. My own hearing is not quite like yours. You may be able to hear quiet sounds that I cannot, or vice versa. When we want to say something general about human hearing, we must therefore base it on experiments performed with many different people. Thus, we can determine how a person with average hearing hears.
Secondly, we don’t at all hear all frequencies equally well. Our hearing is the most sensitive, meaning that we can hear quiet sounds better, around 3000–4000 Hz. To be able to hear a sound at a very low frequency, say 50 Hz, as well as we hear a sound at 3000 Hz, the low-frequency sound must be physically stronger, i.e., its sound pressure level must be significantly higher. The same holds for sounds with very high frequency, say 10 000 Hz.
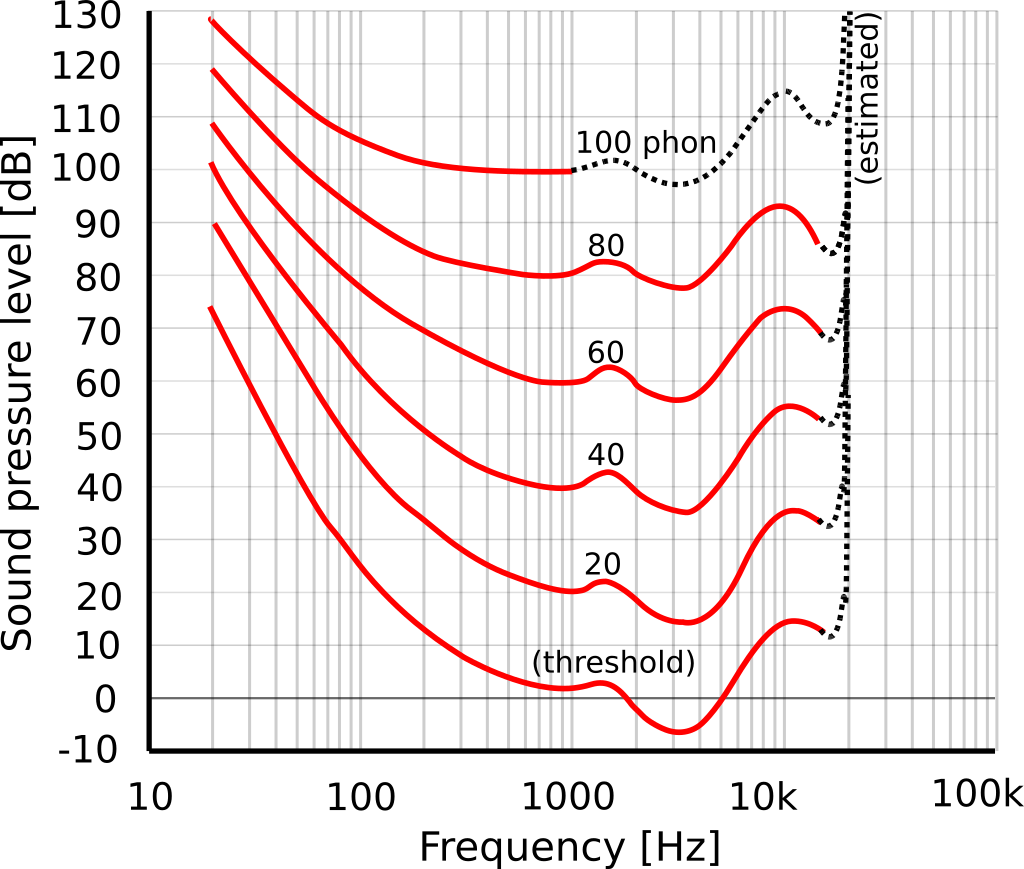
How well we hear different sounds has been extensively studied by researchers as far back as the 1930s. One of their results is equal loudness curves, such as the ones you see to the right. Each of these curves shows tones that an average person perceives as equally loud. For example, we can see that the average person perceives a tone at 1000 Hz with a sound pressure level of 40 dB to be as loud as a tone at 100 Hz with a sound pressure level of 62 dB. We see that the threshold of hearing, which is the weakest sound that we can hear, is at 25 dB at 100 Hz and at -7 dB at 3000 Hz. We can also see that our hearing is very frequency dependent at low sound pressure levels, and that this frequency dependence is less pronounced at higher levels.
A-weighting and other frequency weightings
A number of techniques have been established that let us compare the loudness of different sounds in a way that takes our human hearing into account. The most common is A-weighting, which imitates our hearing for sounds at 40 phon, i.e. for sounds that sound as loud as a 1 kHz tone at 40 dB. C-weighting, which is similar for 90 phon, is also sometimes used. (B-weighting and D-weighting also used to exist, but they fell into disuse long ago. When we don’t do any frequency weighting, it’s sometimes called Z-weighting, where the Z stands for ‘zero’.)
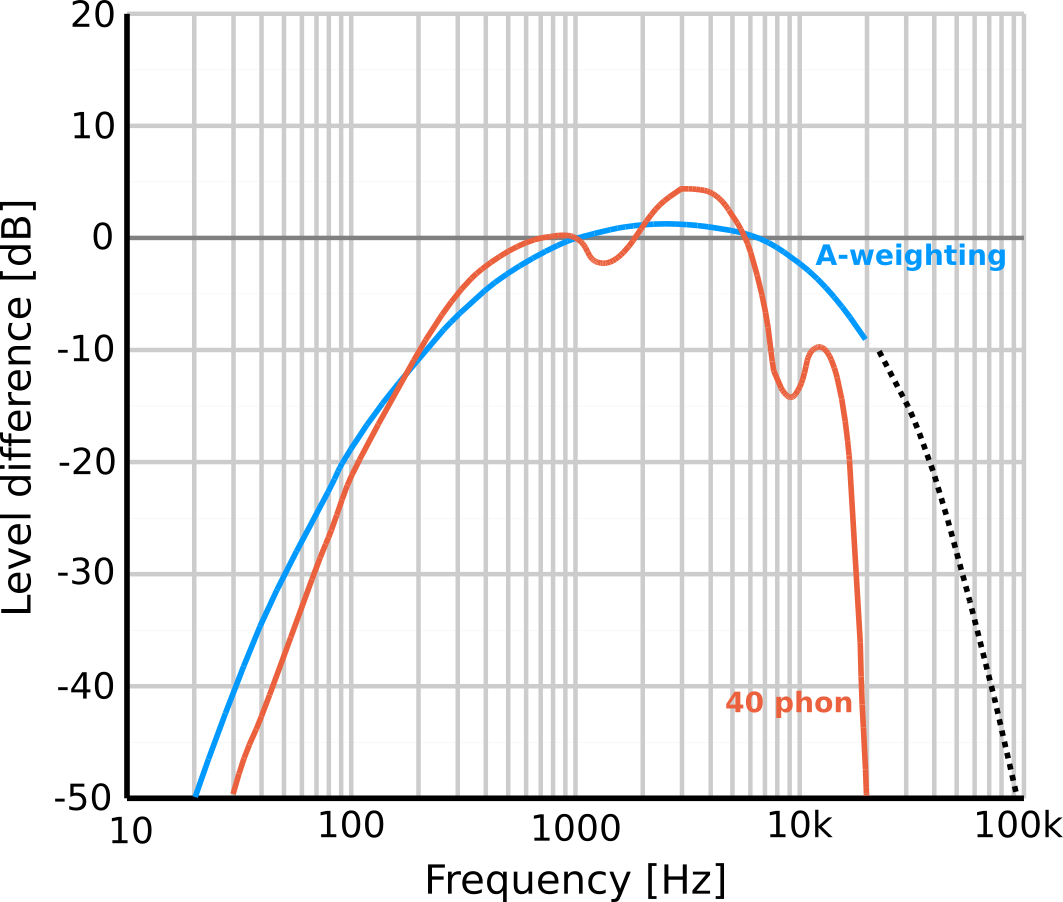
So, how do we use these frequency weightings in practice? Researchers have designed signal filters that we can use in electronic circuits or on computers. We can run recorded sound signals through these filters to get a modified recording where low and very high frequencies have been suppressed in about the same way as our hearing would. The figure to the right shows how the A-weighting filter changes the level of various sound frequencies, comparing it with the sensitivity of our own hearing.
Calculating A-weighted levels
Thus, when we want to calculate an A-weighted sound pressure level, we do it in the following way. First, we filter a measurement of the sound pressure \(p(t)\), getting an A-weighted sound pressure \(p_\mathrm{A}(t)\). Then, we use that to calculate an A-weighted RMS sound pressure as described in part 1, as
\(p_\mathrm{A,rms} = \sqrt{ \frac{1}{T} \int_{t_0}^{t_0+T} p^2_\mathrm{A}(t) \, \mathrm{d}t } \, . \)
Finally, we calculate the A-weighted sound pressure level,
\(L_\mathrm{A} = 20 \times \log \left( \frac{p_\mathrm{A,rms}}{p_\mathrm{ref}} \right) \, . \)
In the same way as unweighted sound pressure levels, we specify A-weighted sound pressure levels in decibels. (It’s not uncommon to write ‘dBA’ or ‘dB(A)’ to show that sound pressure levels have been A-weighted, but this practice is technically incorrect.) People also often use other simplified methods to calculate A-weighted sound pressure. We can consider these methods to be good approximations to the procedure described above.
Limits on louder sounds
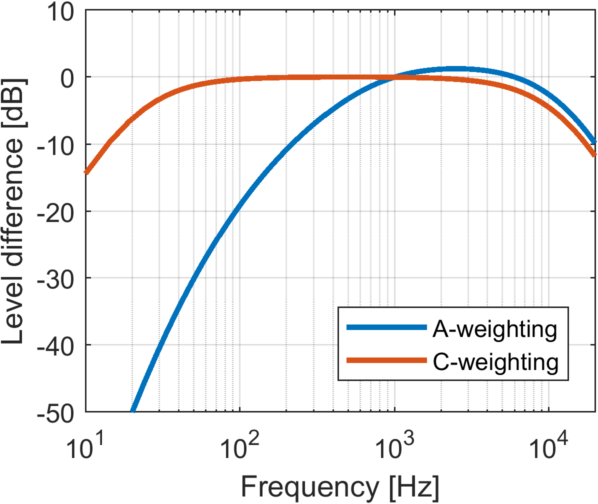
Noise regulations that specify limits for the sound pressure levels from e.g. roads, railways, and airports almost always use A-weighted limit levels. This is usually a decent approach, as these levels are typically close enough to 40 phon that A-weighting fits our perception of these sounds quite well. However, for very loud situations such as concerts, A-weighting does not represent our perception as well, because it suppresses low-frequency sound too much. Therefore, regulations sometimes also specify C-weighted levels for concerts and such, to ensure that there is also a limit on low-frequency sound.
Next time
We have now looked at how we can calculate sound pressure levels from the sound pressure, either directly or with a frequency weighting that takes into account that we perceive different frequencies differently. Still, we have only looked at sounds that are even enough that we can calculate a representative sound pressure through the RMS procedure. Next time, we will look at how we can describe sound pressure levels for sounds that vary in time. Some examples of this are explosions, passing aircraft, and all the different sounds that you are exposed to within the span of a day.
This post is a translation of a Norwegian-language blog post that I originally wrote for acousticsresearchcentre.no. I would like to thank Tron Vedul Tronstad for proofreading and fact-checking the Norwegian original.
Pingback: Acoustic quantities, part 4: Quantities in noise regulations | Erlend M. Viggen
Pingback: Acoustic quantities, part 1: What are decibels? | Erlend M. Viggen
Pingback: Acoustic quantities, part 3: Time variation | Erlend M. Viggen