Explainers

Header for the article "Getting started with acoustic well log data using the dlisio Python library on the Volve Data Village dataset"

Getting started with well log data

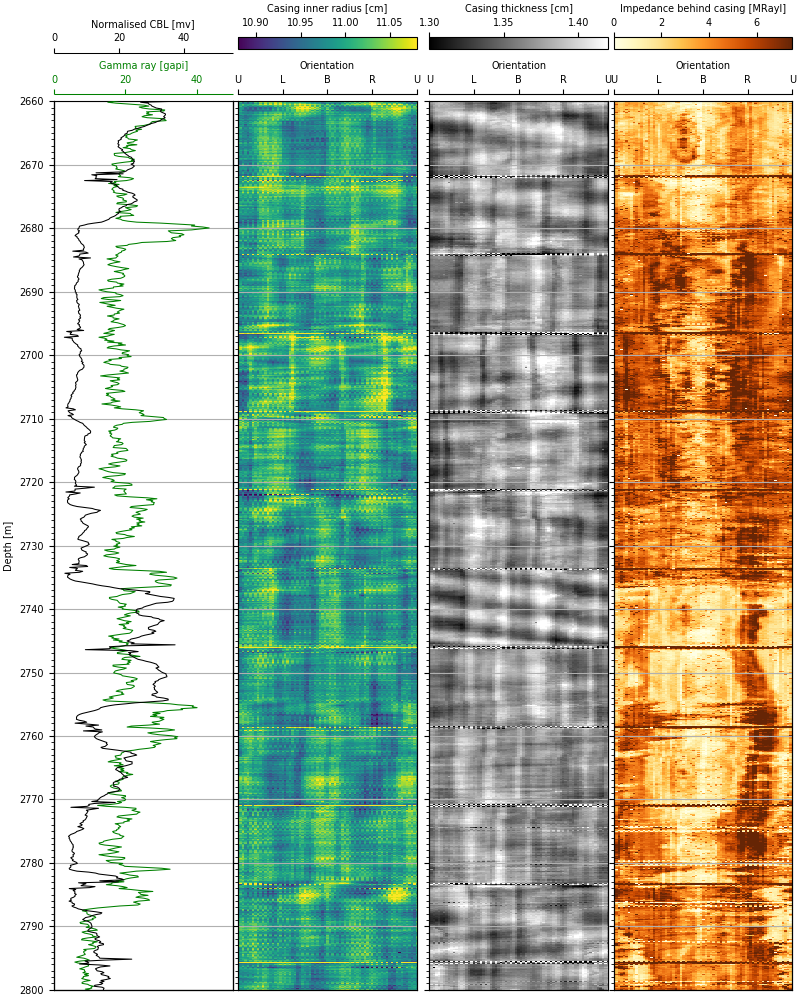
Last year, I wrote a post on DLIS files, one of the most common file formats for well log data. In it, I covered a few different approaches to extract data from such files. It seems like many people struggle with this, because that post quickly became my most popular one. Well over a thousand views later, it’s time to follow it up.

I have been working with acoustic well log data since 2018. During that time, I have learned a lot about how to work with such data, and I have been wanting to share my knowledge. To do so, I teamed up with Equinor’s Erlend Hårstad and Jørgen Kvalsvik, developers of the dlisio library. Since January, we have been working on a tutorial on how to use dlisio to work with well log data. As I am an acoustician, the tutorial naturally focuses on acoustic tools. However, much of what we show is general, valid for data from any tool.

We first presented this work at the 43rd Scandinavian Symposium on Physical Acoustics in the end of January. Just last week, we published the article that we wrote for the symposium’s proceedings. Along with it, we published a companion Jupyter Notebook, which contains the code underlying the article and some further details. As of June 2020, you can even run it on Binder, so that you can play with it online without having to download anything.

Molecules push against the walls of a box by bouncing off

What exactly is pressure?

Sound is something that all of us have heard about. What we perceive as sound is really variations in the air pressure on the eardrum. These variations propagate deeper into the ear as vibrations and then into the brain as electrical impulses. Pressure is therefore central to acousticians and everyone else working with sound.

In this post, I want to tell you about where air pressure comes from. This also tells us something about how the nature of air pressure limits how good it is possible for ears and microphones to become.

Well log plot

Extracting data from DLIS files

Update, April 2020: I just published a tutorial on getting started with well log data. It is based on Equinor’s Volve Data Village dataset and their dlisio library, both of which are free and open. You can read more about the tutorial here, or go straight to the tutorial article and its companion Jupyter Notebook.

In my current research project, I am working with two well log datasets from Equinor. The first is a large dataset that they released to CIUS, my research group. The second is a smaller freely available dataset called Volve Data Village. The files in those datasets contain measurements from many of Equinor’s subsea wells on the Norwegian continental shelf. These data files are primarily in the DLIS format, formally known as API RP66.

Even though DLIS is the most common format for well log data today, only a very limited number of programs can read it. In addition, most of these programs are geared towards displaying the data so that log interpreters can analyse it visually. What I need, on the other hand, is full access to the data so that I can run my own computational analyses.

When I started my post-doc around a year ago, I had to figure out how to get the data out of DLIS files so that I could work with it. Since then, I have learned quite a bit about how to read these files. In this post, I want to share some of what I have learned with you.

arXiv proceedings, final

Publishing conference proceedings through arXiv

In 2010, 2016, and 2019, I was responsible for publishing the proceedings of the Scandinavian Symposium on Physical Acoustics. SSPA is a small conference organised every year at Geilo, Norway. It typically has around 50 participants. Most come from Norway, but many also come from other European countries. After the symposium, participants who held a presentation are encouraged to submit articles to the symposium’s proceedings. Typically, these proceedings end up with 5–10 articles.

In 2016 and 2019, I chose to publish the proceedings through the repository arXiv.org. This can be a very good approach, because many researchers know and follow arXiv. In addition, academic search engines such as Google Scholar indexes arXiv’s articles. However, there is not that much information available on how to use arXiv to publish proceedings. arXiv does encourage using its repository for conference proceedings and has some relevant help pages available. Unfortunately, these pages pooled together do not give you a clear procedure or tell you all that you should know. Therefore, I will show you the overall procedure that I have followed twice, and discuss some possible pitfalls of publishing proceedings through arXiv.

dB

Acoustic quantities, part 4: Quantities in noise regulations

In this series so far, we have looked at how we use decibels to put numbers on the loudness of sounds (Part 1), how we can compensate for humans hearing some sound frequencies better than others (Part 2), and how we can determine decibel numbers for sounds that vary significantly in time (Part 3). We can consider what we have looked at so far as being building blocks. With these blocks, we can construct the acoustic quantities used in noise regulations throughout the world.

In this fourth and final part, we will look more closely at these more advanced quantities. In Norway, for example, noise regulations use such quantities to define concepts such as red and yellow noise zones. (I will use Norwegian noise regulations as an example throughout this post; these are the ones that I have particular experience with. However, noise regulations in many other countries will be similar.) …

dB

Acoustic quantities, part 3: Time variation

In this series, we first looked at what sound pressure levels and decibels are. Then, we looked at how we can calculate sound pressure levels in a way that takes human hearing into account. So far, though, we have only considered steady and unchanging sounds. These come from e.g. ventilation systems or machines that run steadily. But what about sounds that change in time, e.g. sounds from passing cars or aircraft, or from explosions and other bangs? Fortunately, acoustic quantities and techniques exist that allow us to describe and compare these sounds as well. The most important are Slow- and Fast-weighting, sound exposure level, and equivalent level. These are the topics of this part of the series. …

dB

Acoustic quantities, part 2: Frequency weighting

In the previous part of this series, we looked at what decibels are. To put it simply, we can measure a sound, find a representative sound pressure for it, put this into a logarithmic formula, and voilà – we have a sound pressure level in decibels. However,  humans cannot hear every sound equally well. The basic calculation of sound pressure level does not take this into account. This means that there are sounds we can hear hardly or not at all, that have the same physical sound pressure level as sounds that we hear well. Therefore, a number of techniques, such as A-weighting and C-weighting, have been developed to let us calculate sound pressure levels that fit our hearing better.

In this part, we will discuss how sound consists of different frequencies, how we do not hear these frequencies equally well, and how we can take this into account when calculating sound pressure levels. …

dB

Acoustic quantities, part 1: What are decibels?

Sound is, simply put, weak but rapid fluctuations in air pressure: The air becomes a tiny bit denser, a tiny bit thinner, denser, thinner, and so forth. These fluctuations start at sound sources, for example loudspeakers, and spread out like waves. At the sound wave’s peak, the air is at its densest, while at the wave’s trough, the air is at its thinnest.

When these sound waves hit our ears, our auditory system translates them into something that we can perceive consciously — and thus, we hear that the sound is there. Still, it is difficult to describe, compare, and process these subjective experiences. For example, would you and I agree that this sound is stronger than that sound? And if so, how much stronger is it?

To make sound into something that we can measure, describe, compare, and handle, many different acoustic quantities have been introduced. We use these to make sound into something that we can discuss in a more concrete and objective manner. These quantities affect us all, not least because noise regulations use them to describe how much sound e.g. airports, roads, and concerts are allowed to make. In this article series, we will therefore go through the most important acoustic quantities. In this first part, we begin by discussing what decibels are. This is a fundamental quantity used everywhere where sound is described quantitatively. …